


What to look for:
- Peaks: The vertical lines in the spectrum. Each peak represents the hydrogens attached to a specific single carbon atom. The relative area of the peaks are proportional to the number hydrogens attached to each carbon atom.
- PPM (parts per million): This is the scale along the bottom of the graph. It tells us about the "chemical environment" of the hydrogens. Different environments cause peaks to appear at different places along the scale.
- Check the scale using the bottom of the graph where the numbers are (PPM)
- See where the peaks line up with the PPM scale, each peak is a clue to the part of the molecule
- Understanding the peaks in an NMR spectrum is crucial for interpreting the molecular structure of a compound. The number of peaks within a signal (multiplicity) can tell you about the number of neighboring hydrogens (protons) to a given hydrogen atom. This is often explained by the n+1 rule
where n is the number of neighboring hydrogens.
- If you see a single peak, it means there are no neighboring hydrogens affecting the signal
- Two peaks suggest there's one neighboring hydrogen.
- Three peaks indicate there are two neighboring hydrogens.
- Four peaks suggest three neighboring hydrogens.
- The size of the peak (height) can tell you how many hydrogens are in that group
×
Select a Liquid
Select a test, Hover over the 'i' for more information (NMR and IR disabled on each liquid until 2 tests completed)
i
A pH test measures the acidity or alkalinity of a substance on a scale from 0 to 14, where 7 is neutral, values below 7 are acidic, and values above 7 are alkaline.
i
The sodium bicarbonate test for liquid identification involves adding sodium bicarbonate to a liquid to observe carbon dioxide gas production, indicating the presence of an acidic compound.
i
The iodoform test for liquid identification involves adding iodine and sodium hydroxide to a liquid, where the formation of a yellow precipitate indicates the presence of methyl ketones or ethanol.
i
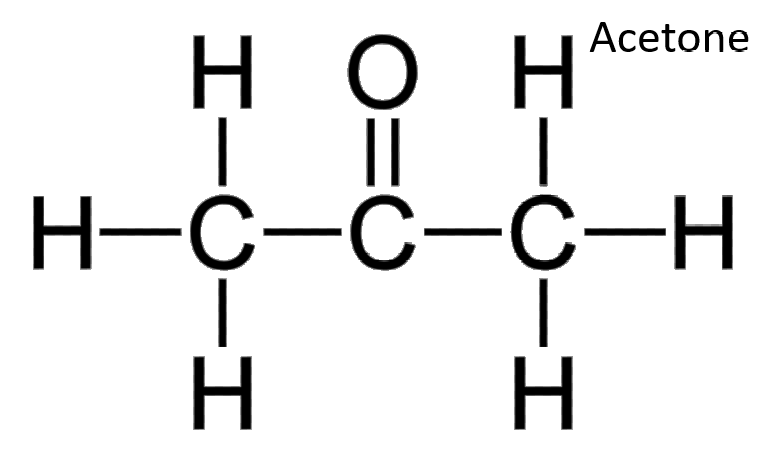
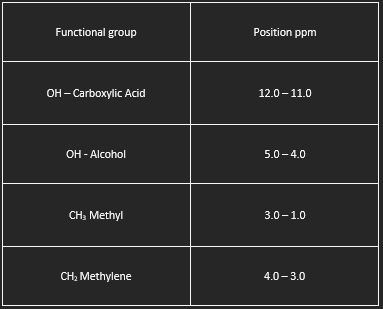
Nuclear magnetic resonance spectroscopy (NMR) detects hydrogen atoms in different functional groups. Functional groups can be identified by their position in the NMR spectrum. Use the graph below to identify the samples identity.
What to look for:
i
- Peaks: The vertical lines in the spectrum. Each peak represents the hydrogens attached to a specific single carbon atom. The relative area of the peaks are proportional to the number hydrogens attached to each carbon atom.
- PPM (parts per million): This is the scale along the bottom of the graph. It tells us about the "chemical environment" of the hydrogens. Different environments cause peaks to appear at different places along the scale.
- Check the scale using the bottom of the graph where the numbers are (PPM)
- See where the peaks line up with the PPM scale, each peak is a clue to the part of the molecule
- Understanding the peaks in an NMR spectrum is crucial for interpreting the molecular structure of a compound. The number of peaks within a signal (multiplicity) can tell you about the number of neighboring hydrogens (protons) to a given hydrogen atom. This is often explained by the n+1 rule
where n is the number of neighboring hydrogens.
- If you see a single peak, it means there are no neighboring hydrogens affecting the signal
- Two peaks suggest there's one neighboring hydrogen.
- Three peaks indicate there are two neighboring hydrogens.
- Four peaks suggest three neighboring hydrogens.
- The size of the peak (height) can tell you how many hydrogens are in that group
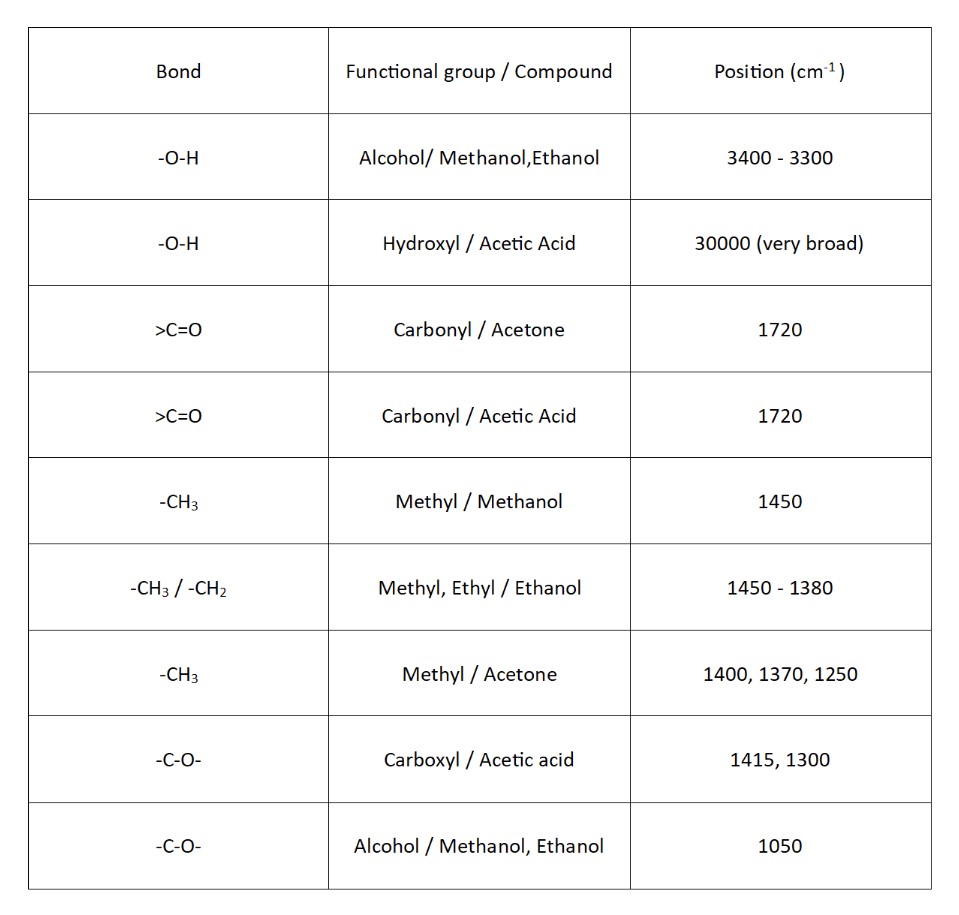
IR (Infrared Spectroscopy) is used to identify functional groups in molecules based on their vibrational transitions. Below is a table that will help you with reading the outputs of the IR Spectroscopy.